New report system
Create better looking reports with our new report system.
General workflow
When a report is generated it is opened in a word processor. It can be modified using the ribbon style user interface. The report can then be printed and/or saved as a file.
Edit template
When you create a new template, you can either change the existing one in IGEMS or create a new one. To change the template, make a report and press “F5” when you have opened the report.
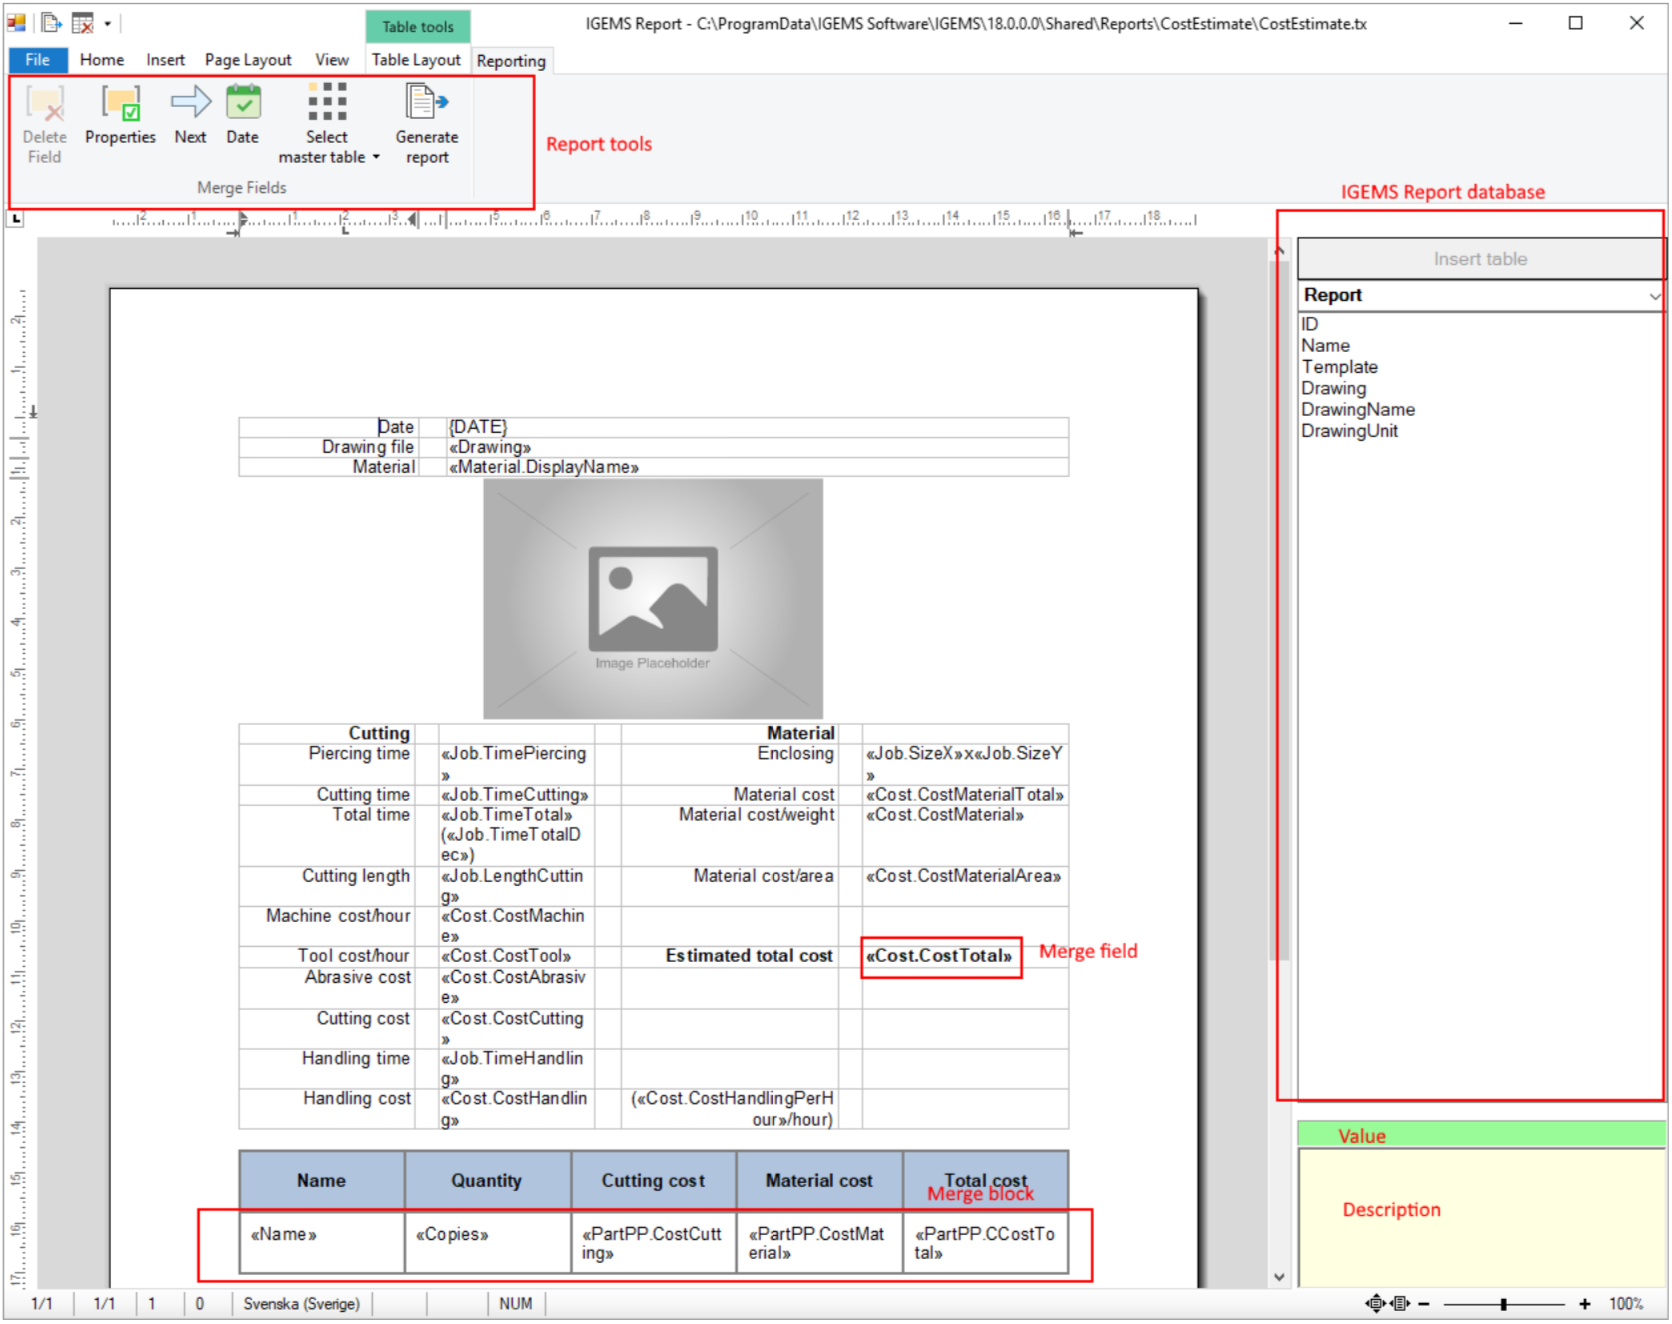
The layout of the editor is familiar with Microsoft Word, but we’ve added a panel to the right with all the posts from our database. There’s a dropdown menu that will show the different values for each report category. You can also insert images, charts, barcodes etc. to make the report more customised for your needs. More about that later.
New table
To insert a new table, click with the cursor on the report where you want the table and select the category from the dropdown menu you want to display in the table. Then click the “Insert table” button just above the category dropdown menu.
Insert data
A data field is a tag from the database that will be populated with data when running the report.
To insert a data field, place the cursor in the document and double click on the field in the right panel.
To delete a data field, select the field with the mouse and press delete or the “Delete field” button.
To change the properties of a field, like number of decimals etc. double click on the field or press the “Properties” button.
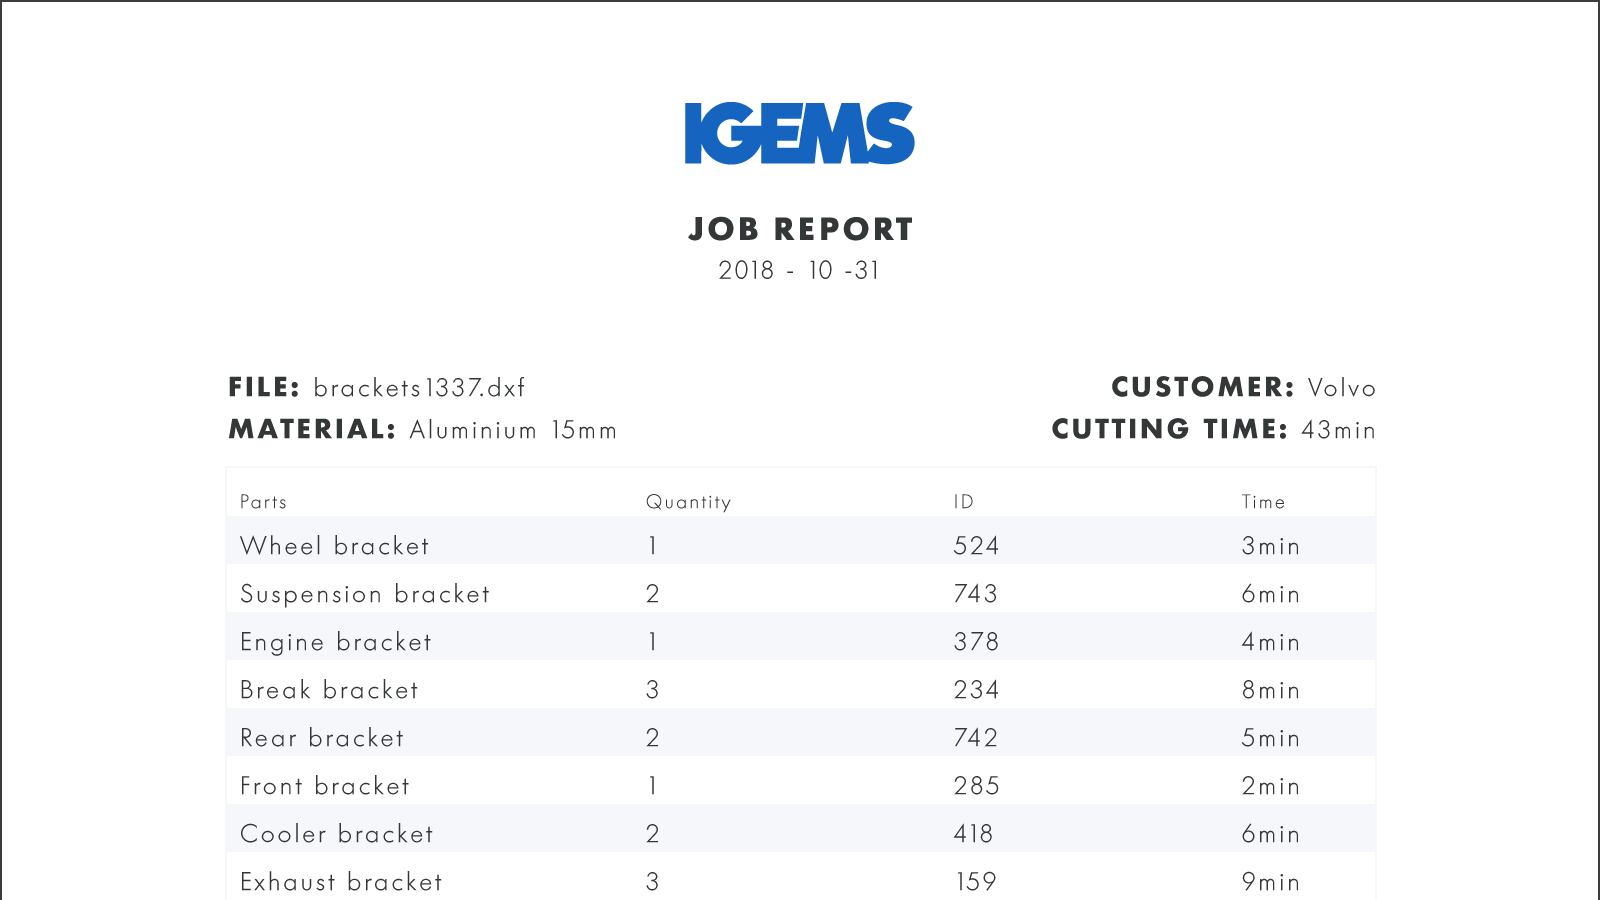
| Part | ID | Time |
|---|---|---|
| Bracket | 1337 | 53s |
| Taper curve | 451 | 41s |
| Car part | 73 | 135s |
Design
To make your information easy to read and represent your company’s color, we’ve added some new design features for the report. Most of the functionality will remind you of Microsoft Word and will not be found in this information.
You can set the style of a table from a predefined list of designs. Double-click on a table or click the tab “Table layout” and then “Design” to change the style. This will bring up the tables design dialog. Select the design you like and press OK. For instance, you can create tables where every other row is filled with a background color. Like the one above.
Remove formatting
The design will be removed from the table.
Reset table
The table will be restored to a simple default style.
Labels
You can generate reports for label printing. What we do is dividing the sheet in a format you design. Preferably the same format as your labels.
Labels are created using tables, so you select the table category you want to use (from the drop down list to the right) and click “Insert table”.
Labels
1. To create labels for a normal printer with a document of labels click “Labels”. The Labels configuration dialog is shown.
Width and Height sets the with and height of the label.
Spacing sets the space between two columns.
Columns sets the number of labels on one row.
Page margins sets the margins of the page. Predefined have a list of sample labels.
You can save and delete labels from the predefined list.
2. When you have clicked “OK”, one row of the table is inserted. Here you can add fields with information as usual.
3. To display continuous information in each label, you have to add the “Next” function in the end of each label. You’ll find the “Next” function under the “Reporting” tab at the top. You have to do this on every label except the last one.
Label printer
1. To create labels for a label printer with one label per page choose “Label printer”. A table is created with just one table cell fitting the whole page.
In this case you should not use the “Next” field.
This will create a report that can be used for special label printers. Before creating this table you should clear the report and select the correct paper-size.

QR/Barcodes
Because of the demand of tracing materials and products, we are now supporting barcodes in IGEMS.
To insert a barcode into your report, do the following:
1. Go to the tab “Insert” and click the barcode button.
2. Select the type of barcode you want to use.
3. Double click on the barcode to get to the properties page. Here you can connect the barcode to the database or set the text for a non-connected barcode. You can also change the type of the barcode as well as other settings.
Note! Every type of barcode has certain limitations. It can be a minimum and maximum length of the text to encode for example. If the data from the database is not valid for a certain barcode then the barcode will not be encoded correctly. So, it is important to format the data correctly for the chosen barcode.
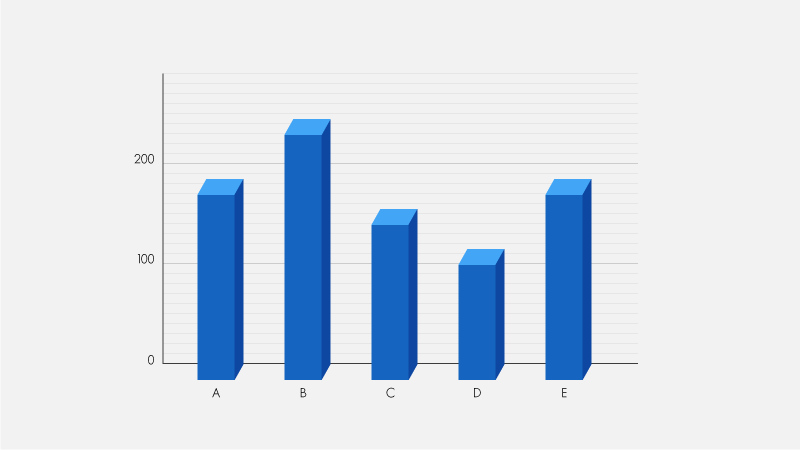
Charts
You can create charts driven by the data from IGEMS. We support all different kinds of charts, from pie charts to bar columns to 3D charts.
1. Go to the tab “Insert” and click the chart button.
2. Select the chart and go to the “Chart layout” tab.
3. Select “Set data relation” and select the data.
Now the data you select for the chart categories will be displayed in the chart.
Scripts
Our report system supports scripts to make special applications.
Lisp functions
You can use lisp to create special functions.